
Flood Risk in NZ: The Cost Is Catching Up With Property Owners
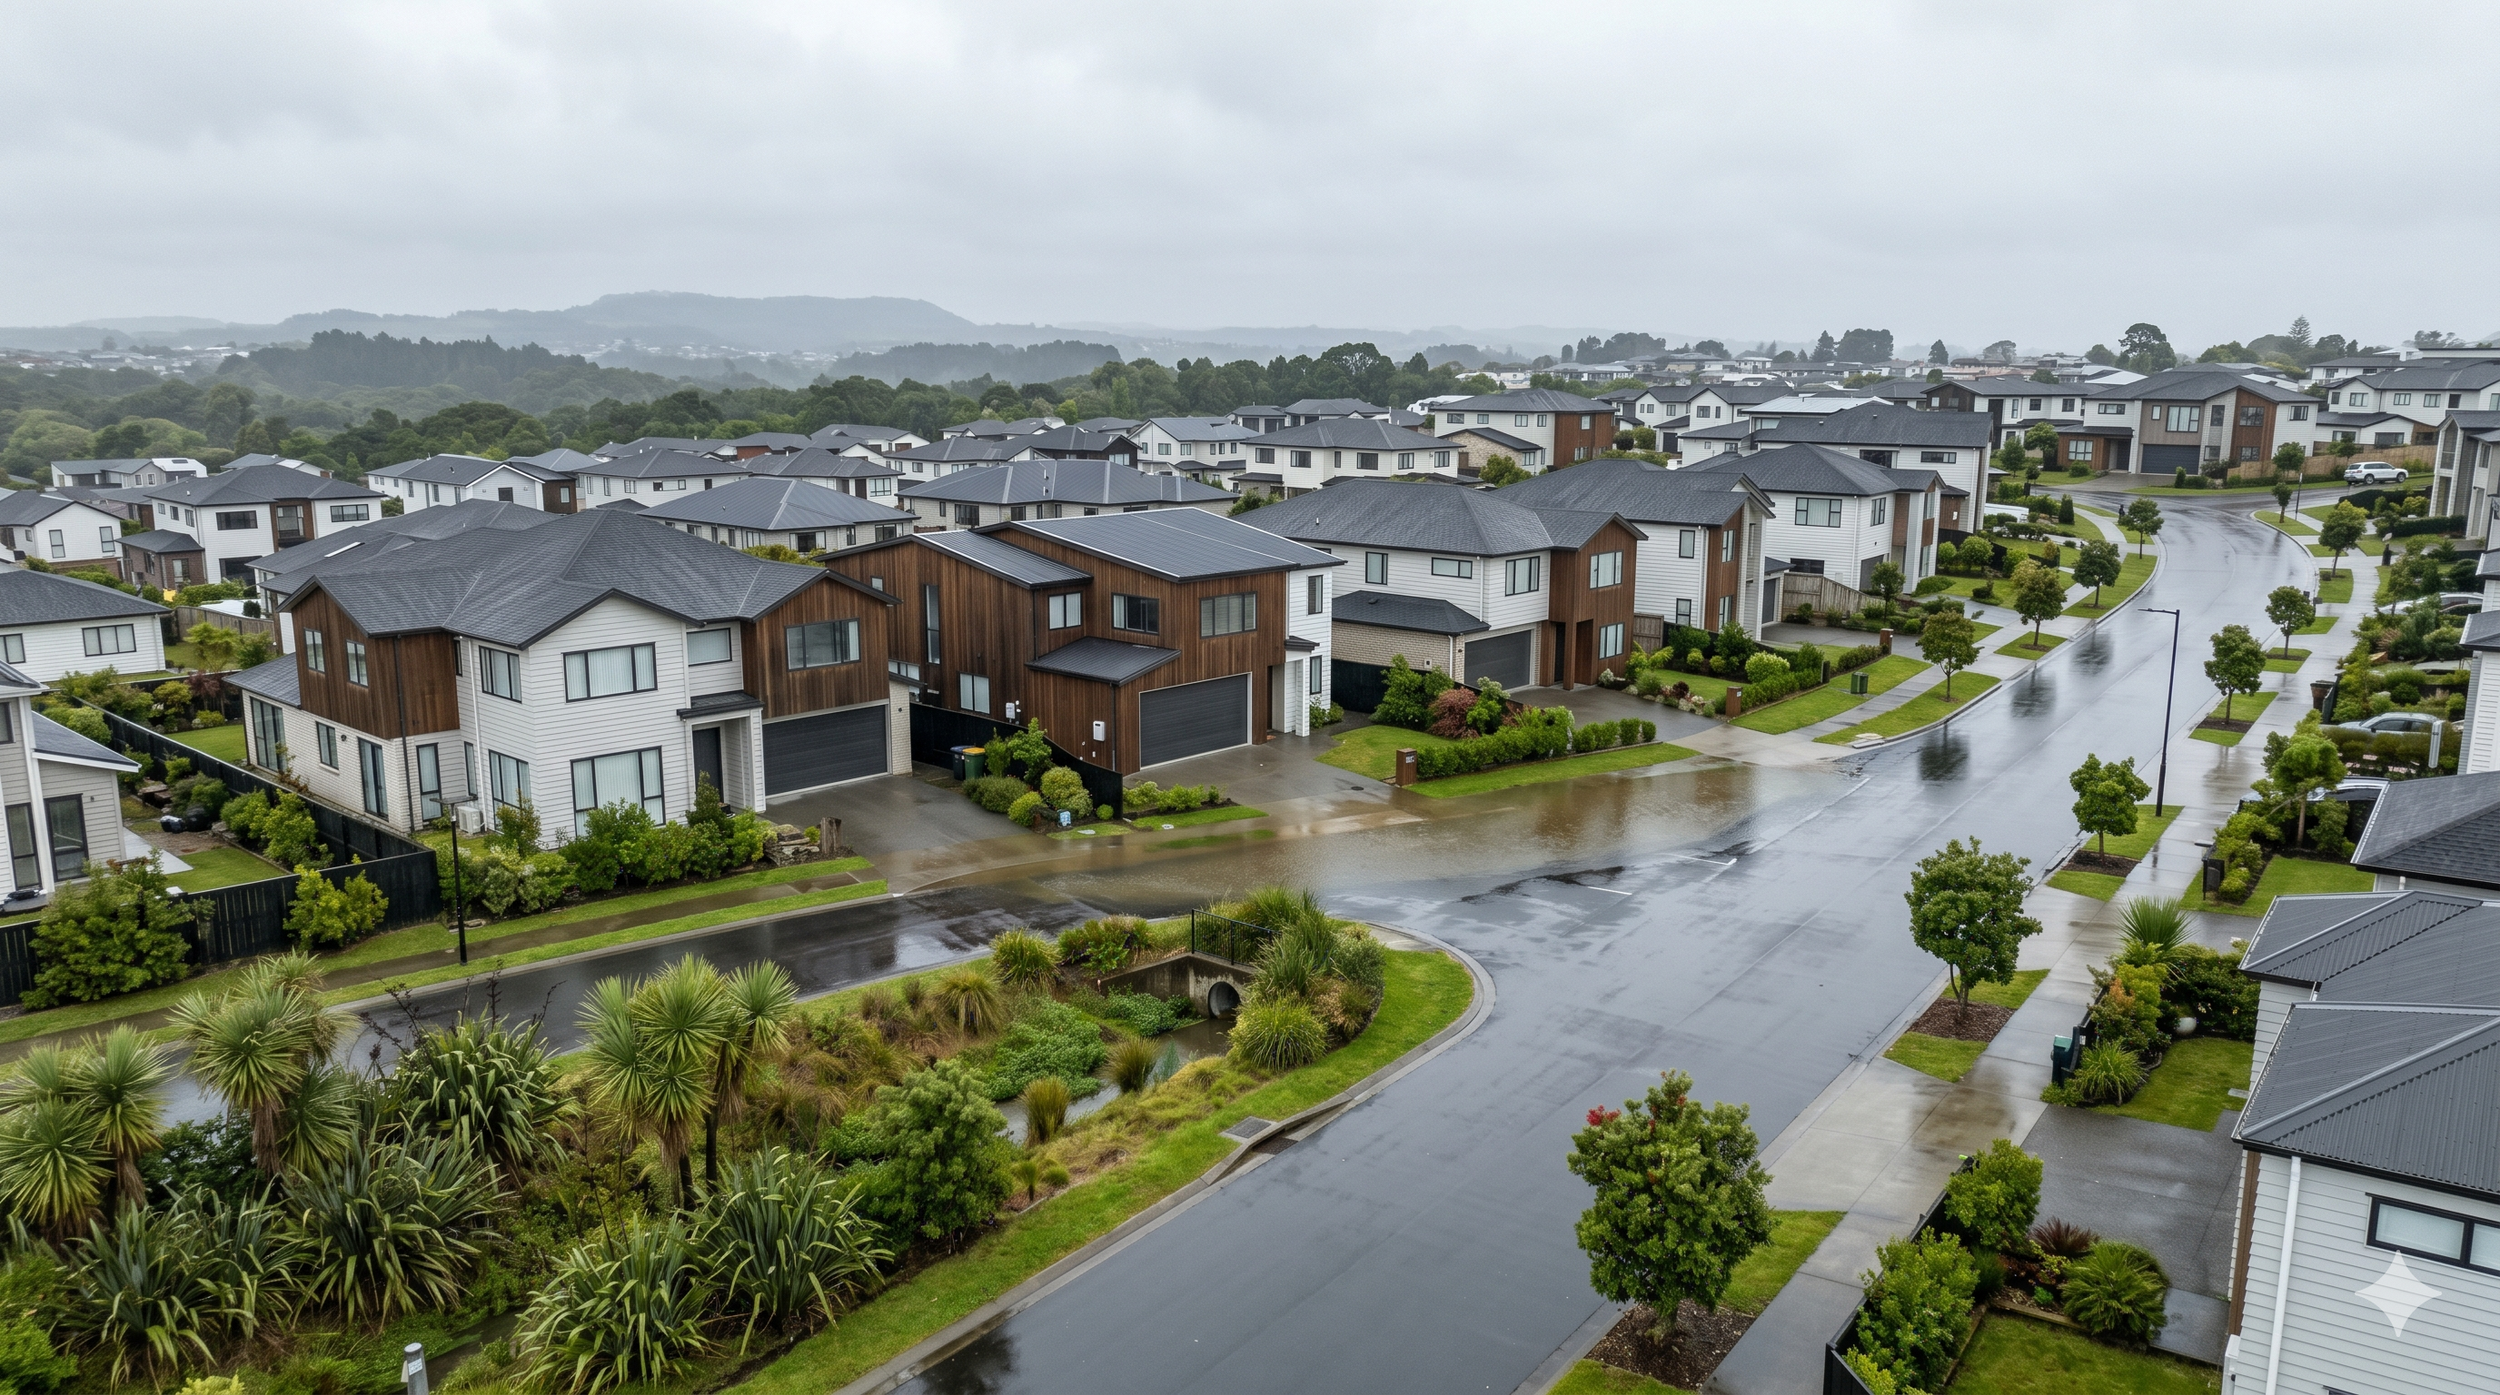
The Auckland Anniversary Weekend floods of January 2023 and Cyclone Gabrielle weeks later caused over $13 billion in damage across the country. That bill is still being paid — not just in repairs, but in premiums, lending conditions, hazard maps, and the slow re-rating of what a "safe" property actually looks like in NZ.
For property owners, the practical question isn't whether flood risk matters. It's whether the systems built around them — insurance, banks, councils, valuers — are starting to treat their property differently than they did before 2023.
In most flood-prone parts of the country, the answer is yes.
Insurance Is Now Risk-Priced
Commercial property insurance sits at a different point in the cycle. There's no equivalent public risk-based-pricing announcement, and the market is currently soft — insurers are competing for premium volume, which means even higher-exposure commercial sites can still find cover at competitive rates. That changes when the market hardens. Owners and operators who put flood resilience in place during the soft cycle will be materially better positioned when underwriting tightens — and on current trajectory, it will.
On the residential side, NZ insurance has been moving toward risk-based pricing fastest. For decades, flood exposure was treated as a community-rated cost. Premiums in flood-prone areas were higher than the national average, but not by much. The 2023 events accelerated a shift that was already underway: insurers are moving toward risk-based pricing, where premiums reflect the actual flood exposure of the individual property.
In practice that means:
- Properties in mapped flood-hazard zones are seeing premium increases in multiples, not percentages
- Some insurers are declining to write new business in some of these flood prone areas. e.g. Westport.
- The gap between "everyone pays the same" and "you pay what your property costs to insure" is widening every renewal cycle
- New buyers are being quoted on the current risk view, not the legacy rate the previous owner had
Tower, IAG, and Suncorp have all signalled the direction. The Reserve Bank's Financial Stability Reports have flagged it. The Insurance Council of NZ has been open about the shift. Owners who haven't reviewed their cover since 2022 are often discovering the change at renewal.
Banks Are Asking Different Questions
Lending has followed insurance. Banks underwrite against the insurability of the property, not just its market value. A property that's hard to insure is harder to lend against.
That's showing up in a few places:
Pre-approval conditions referencing flood-zone status and the current insurer position
Valuation reports flagging flood history and council hazard mapping more consistently than they used to
LVR considerations on properties in high-risk zones, particularly for investment lending
Refinancing friction when an existing mortgage rolls over and the bank reassesses the property's risk profile
None of this is hypothetical. It's the practical mechanism by which national flood risk gets priced into individual loans. Buyers, sellers, and refinancers are feeling it.
LIMs and Council Hazard Maps
Local councils have been updating their flood-hazard mapping since 2023 — partly because the events themselves exposed gaps in the existing data, and partly because the central government has pushed harder on natural-hazard transparency.
A LIM today is far more likely to include flood-hazard information than one from five years ago. Where a property sits relative to:
- Modelled 1-in-100-year flood extents
- Overland flow paths
- Areas of identified flood history
- Coastal inundation projections
...is now standard content on many regional LIMs, and is heading toward standard nationwide.
The practical consequence is that a property's flood exposure is no longer hidden by the absence of a recent event. The map shows up on the LIM. The LIM shows up in the due diligence pack. The information is in the market.
The Property Value Catch-Up
For buyers, the new context shows up in three places: the LIM, the insurance quote, and the lending decision. For sellers, it shows up in time-on-market and final sale price for properties on the wrong side of the new risk lines.
Real estate agents in flood-affected areas across Auckland, Hawke's Bay, and parts of Canterbury have been candid: properties with documented flood history or hazard-zone status take longer to sell, attract fewer offers, and frequently transact below initial expectation.
That's not punishment. It's the market pricing in information it didn't price in before.
For owners with no immediate plan to sell, the same dynamic still matters. Property is collateral. Collateral is priced. A property that's harder to insure, harder to lend against, and clearly mapped as flood-exposed is a different financial asset to what it was in 2022 — even if nothing physically has changed about the building.
Building Standards in Flood-Hazard Zones
For new builds and significant alterations, consent authorities have tightened their expectations. In Auckland and other flood-affected councils:
- Flood-hazard zones trigger natural-hazard reporting under the Building Act
- Minimum floor levels are being applied more consistently
- Flood-protection design — permanent barriers, drainage planning, backflow protection — is now a consent condition for properties in mapped exposure areas
- Permitted activity status can drop to a discretionary or non-complying consent purely because of flood-hazard mapping
Architects and developers working in affected zones have adapted. Owners undertaking renovations on existing properties are sometimes surprised at how much the consent pathway has changed.
What Property Owners Should Actually Do
Most owners' first response to the shift is to do nothing, on the basis that the last flood didn't reach them. That logic only holds if the next event is the same as the last one — which the modelling, the insurance industry, and the councils all reject.
A few practical moves carry their weight regardless of how exposed a property is:
Find out what's actually on the LIM. Flood-hazard mapping changes. The LIM today isn't the LIM from when the property was bought.
Check the insurance position. Narrowed cover, raised excesses, or renewal hesitation are the early signals.
Look at the obvious vulnerability points. Garage doors, low-set entries, drainage connections, subfloor vents. A property doesn't have to be in a 1-in-100 zone to lose its ground floor to a localised overland flow event.
Treat flood resilience as a building decision, not an emergency response decision. Sandbags arrive after the warning. The properties that fare best are the ones that didn't need them in the first place.
Where This Is Heading
The direction is consistent across the system: more information disclosed, more risk priced, more resilience expected at the property level. The 2023 events accelerated it but didn't create it. Climate-driven rainfall intensification, urban densification, ageing drainage infrastructure, and central government policy on natural-hazard transparency would have produced the same outcome on a longer timeline.
For owners and developers, the implication is straightforward. Flood risk is no longer a problem that arrives with a storm. It arrives with the LIM, the renewal notice, the lender's email, and the next valuation. By the time the storm shows up, the property's position has usually already been settled.
Getting Ahead of It
The properties that do best in the new environment are the ones whose owners did the work before they had to. Updated insurance, current LIM, honest assessment of vulnerability points, and — where the exposure justifies it — permanent flood protection sized to the actual risk.
Watersmart works with property owners, developers, and councils across NZ to assess flood exposure and specify protection that matches the site, the risk, and the consent requirements. Talk to the team about your property's position.
